How do AI agents perform under realistic production stress?
Oviya Seeniraj, Mihir Kachroo, Gary Shen
We evaluated how AI agent performance degrades under realistic stress—timeouts, auth errors, and flaky APIs—on EnterpriseOps-Gym. Performance drops significantly, exposing gaps in agent testing that rely only on clean end-to-end tests.
Series · Adversarially stress testing AI agents using environments
Intro
Most AI agent evaluations measure performance on clean, end-to-end tasks. But real enterprise environments are messy—APIs timeout, authentication fails, and responses break.
As a result, strong benchmark performance often overestimates how agents behave in production.
Question: If an agent performs well in ideal conditions, how much does it degrade under realistic friction?
To answer this, we evaluate agents against a baseline EnterpriseOps-Gym and a stressed version based on Shah et al., 2026 of the same tasks. We selected an enterprise environment that is representative of the real world and a stress profile that is realistic and resolvable. to test high-impact, realistic agentic applications.
What we built
We evaluate robustness by running the same 100 tasks under two conditions:
- Baseline: no failures
- Stress: injected, recoverable faults
Our stress profile focuses on realistic, fixable failures. Essentially, the same tasks are run, but the agent has two obstacles rather than one. Not only must it complete the agentic enterprise task, but it must also resolve the following injected faults that it runs into:
- Timeouts
- Auth errors
- Malformed responses
- Tool/API friction
Each task is run three times per condition to account for variability. To keep experiments tractable, we sample 100 statistically representative tasks (from ~1,150 total), with a budget of 8,192 tokens per task.
The evaluation spans eight enterprise environments ("gyms"), capturing behavior across different workflows—not just a single tool.
Agents can retry, replan, and recover -- so success remains achievable.
We evaluate agents on two metrics: full-task success and verifier pass. Full-task success is the agent's ability to complete the task, while verifier pass is the agent's ability to make progress by taking the correct actions towards the correct end state.
Key takeaways
The core takeaway: performance in clean, expected conditions doesn’t translate to realistic environments. When exposed to representative failure modes, success rates drop sharply—enough to materially impact deployment.
Viewed through retention, only a fraction of baseline performance survives under stress: full-task success drops to 19.6% of its baseline level, while verifier pass retains 43.9%. This gap shows that agents often make partial progress, but far less often reach a correct end state.
| Gym | Tasks × runs (n) | Base succ | Stress succ | Base verifier | Stress verifier |
|---|---|---|---|---|---|
| calendar | 33 | 42.4% | 15.2% | 73.3% | 41.4% |
| csm | 42 | 2.4% | 0.0% | 25.8% | 10.4% |
| drive | 33 | 27.3% | 9.1% | 46.2% | 29.4% |
| 36 | 38.9% | 2.8% | 60.4% | 22.6% | |
| hr | 42 | 9.5% | 0.0% | 29.7% | 15.6% |
| hybrid | 39 | 25.6% | 5.1% | 51.0% | 26.9% |
| itsm | 42 | 28.6% | 2.4% | 45.7% | 12.1% |
| teams | 33 | 24.2% | 6.1% | 52.5% | 11.8% |
I. Stress sharply lowers both end-to-end success and verifier-level progress
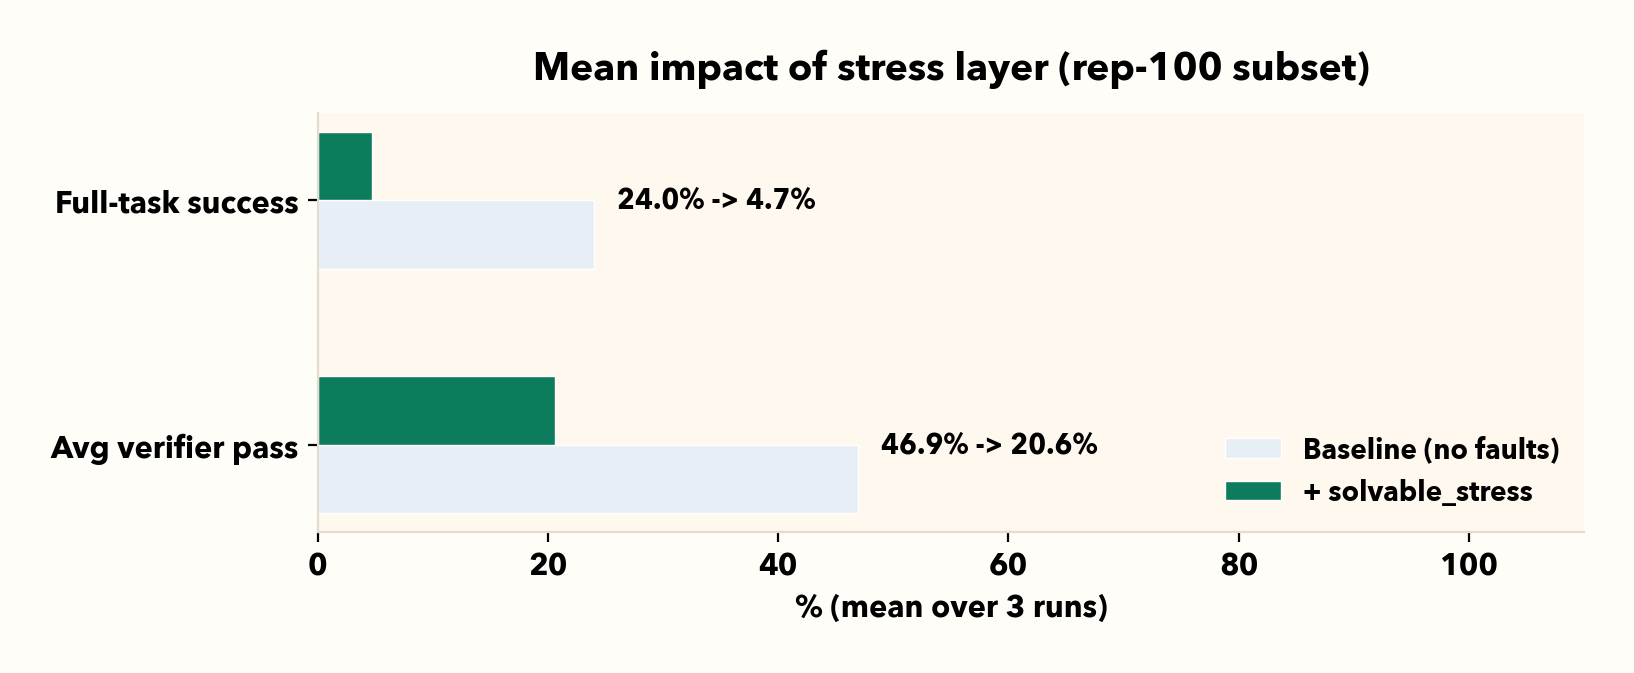
Across three runs, full-task success falls from 24.0% to 4.7% (-19.3 pp) and average verifier pass falls from 46.9% to 20.6% (-26.3 pp).
It is clear that both the ability of the agent to complete its task and to make progress towards it is stunted by our stress profile. By tracking both metrics rather than simple success, we can assess exactly where the agent begins to break down and behave incorrectly upon encountering production failures.
II. Taxonomy-grounded stressors make the failure actionable
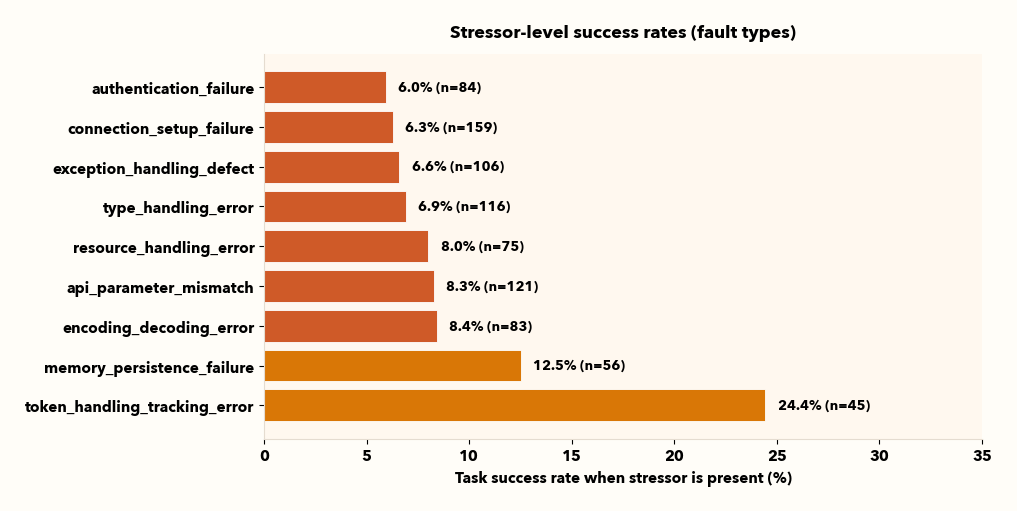
Just knowing that your agent doesn't complete its task is not actionable. Viewing failures from a taxonomy granularity allows us to analyze and resolve the root causes of major failures.
Some stressors are consistently more damaging than others (for example, auth-related failures are often among the harshest). Tool-call failures are summarized as one “tool error” family in the chart, but the underlying logs still contain familiar subtypes like timeouts, validation errors, auth errors, and rate limits.
Viewing failures from all granularities is important and allows us to bridge the gap between evaluation and engineering work.
III. One average can hide environment-specific risk (use the per-gym breakdown sparingly)
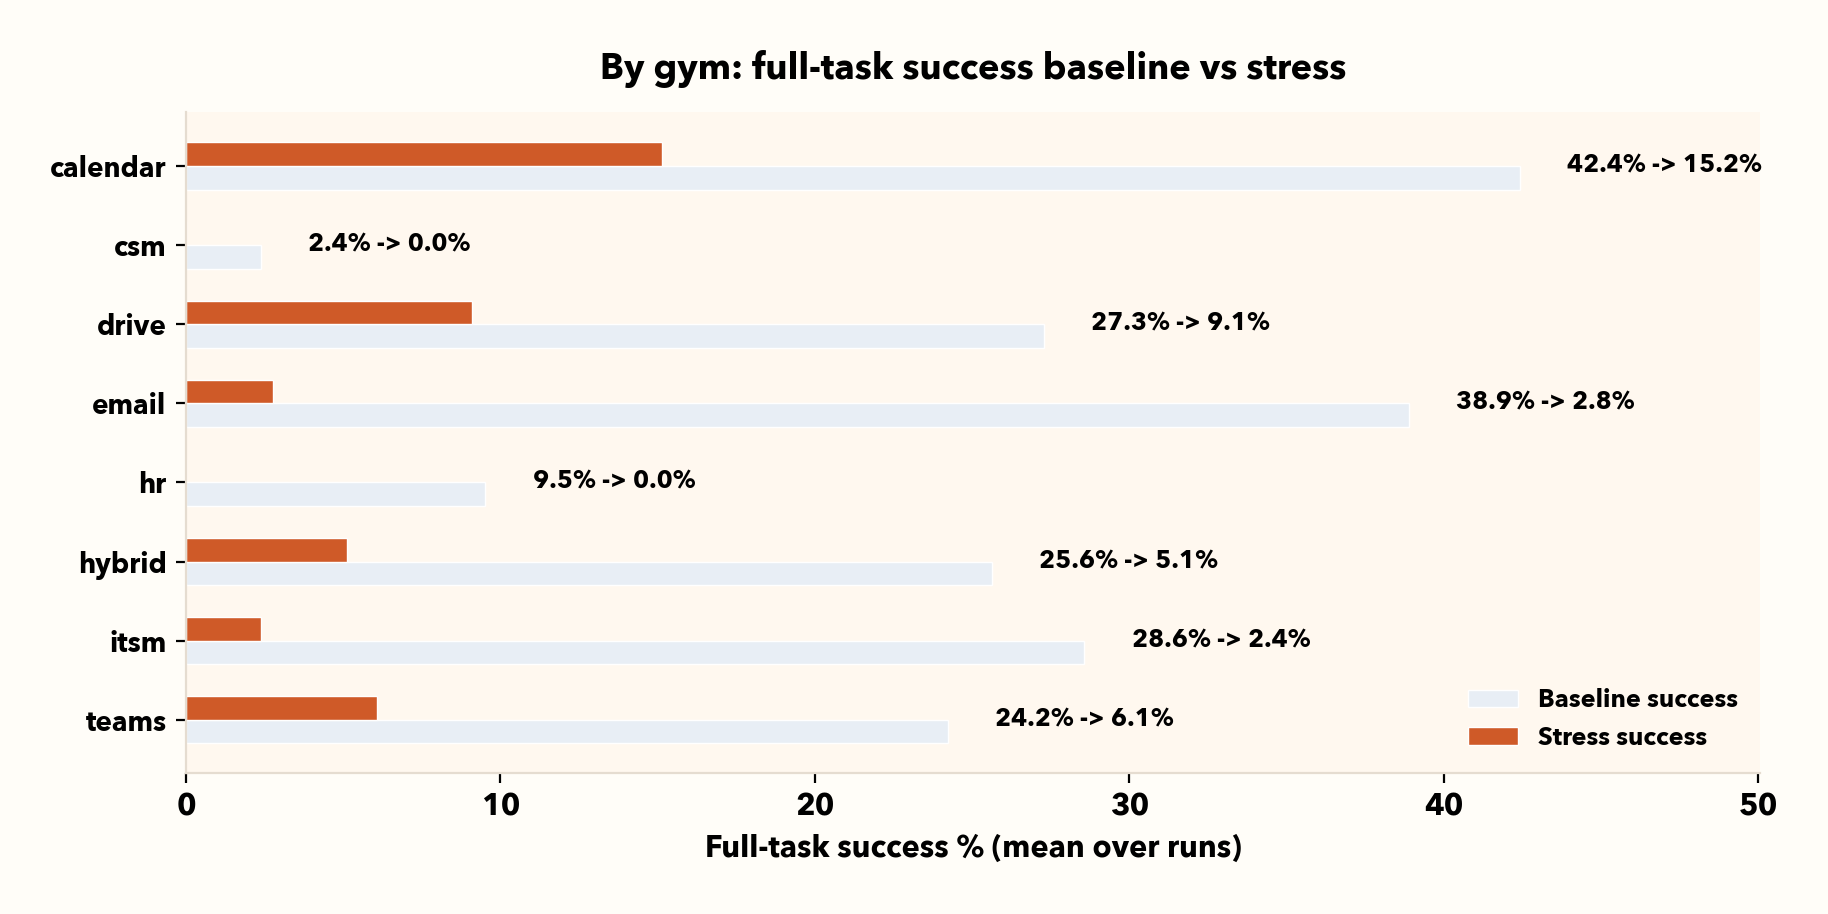
Aggregate numbers are great for tracking progress, but they can hide risk if you only deploy into one slice of enterprise work. The per-gym table is a simple “where to look first” breakdown useful for multi-app agentic workflows.
We can use this as a diagnostic: pick the environments closest to your deployment surface and validate robustness there before you ship.
IV. Stress results bounce more than baseline results, so repeat runs matter
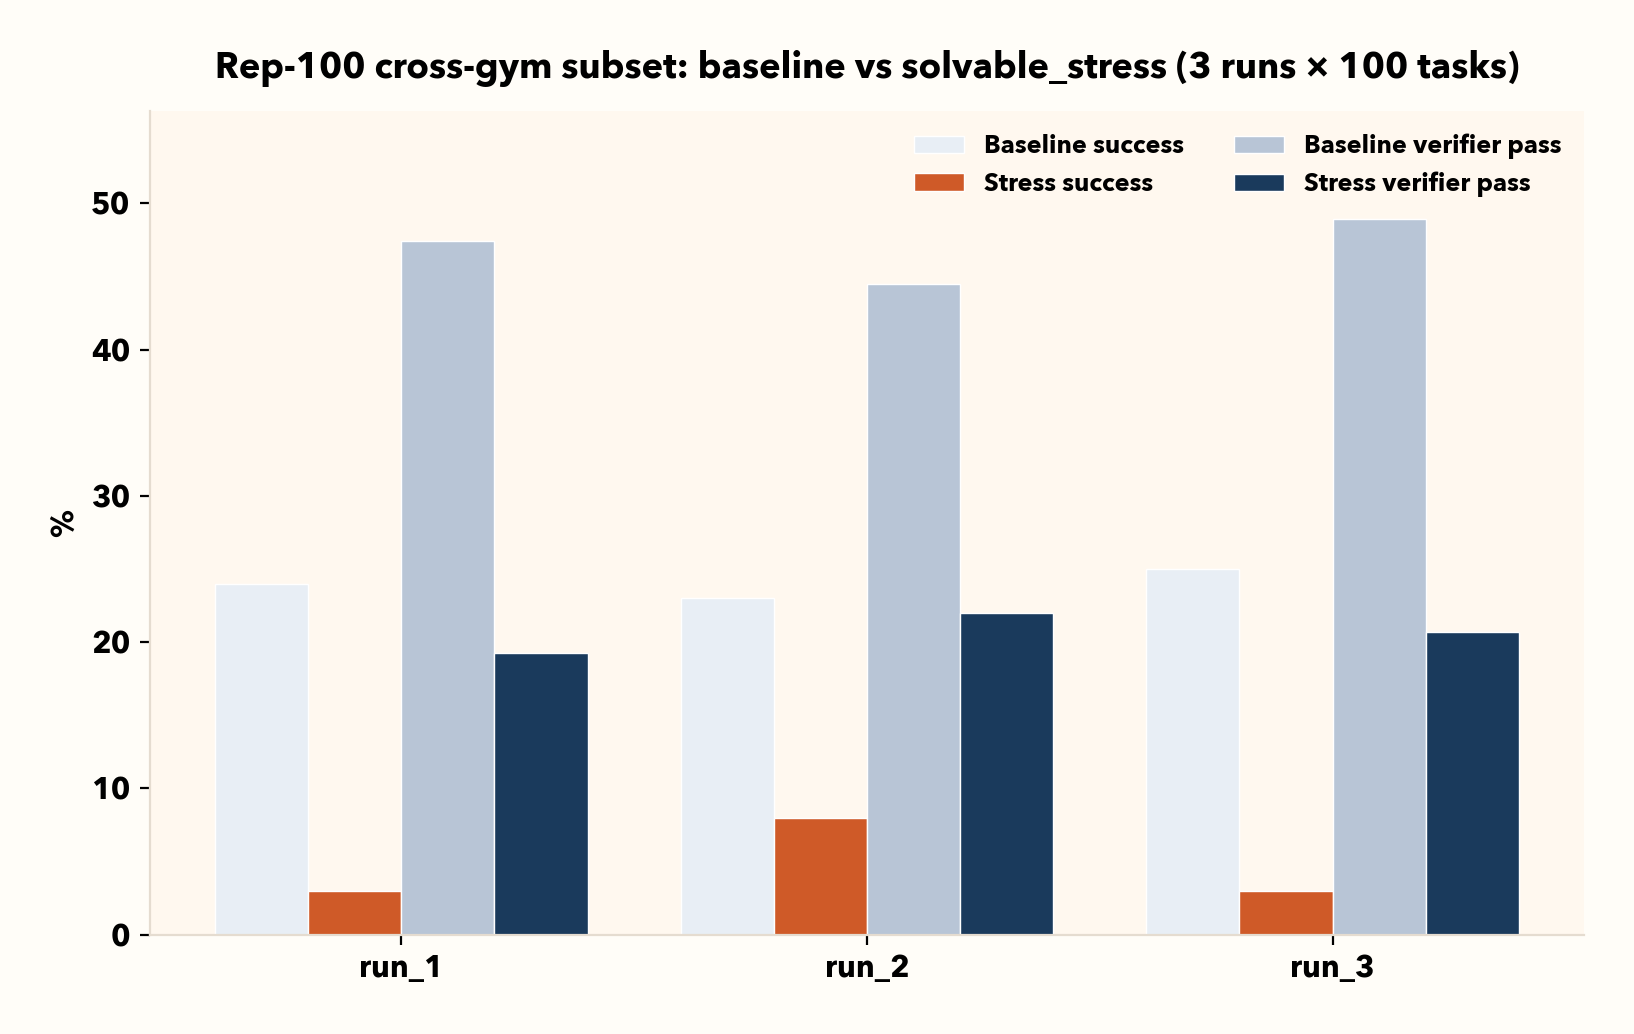
Baseline results are comparatively steady run-to-run, but stress results vary more. That’s expected: stress introduces stochastic “when and where” friction and surfaces brittle recovery policies.
In practice, it is important to quote stress numbers with multiple runs and compare means (and, if needed, variance) rather than one-off runs.
Next steps
Our next blog will go beyond static stress tests by generating harder tasks and environments based on where the agent fails, applying unsupervised environment design (UED) methods.
Instead of a fixed stress profile, we’ll adapt scenarios to target known weaknesses by different granularities such as specific gyms and failure types. We turn the benchmark into a feedback loop that focuses on fragile areas and tracks whether fixes improve performance under stress.
Interested in our work, access to this experiment, or looking to collaborate? Reach us at [email protected].